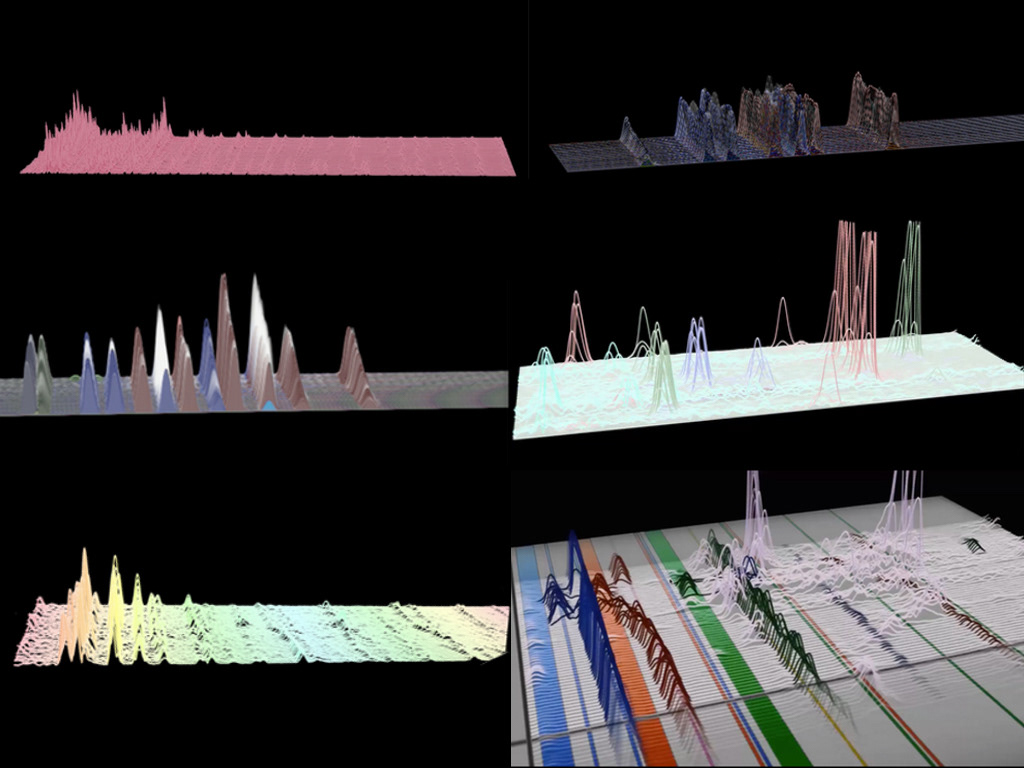


3D spectrograms are related to “waterfall plots”. In the past they have been used for visual representation of data in various applications including: engine testing, acoustic response of a room, oncology. The waterfall plot essentially represents two dimensions of data over time. The 3D spectrogram does the same thing but to an audio signal. The frequency and volume of a sound are represented over time using Fast Fourier Transform. The 2D spectrogram can do the same thing, except that colour or brightness are commonly used to depict volume, and this may not be as intuitive or accurate as if volume is visually depicted on a separate spatial axis.
I use Adobe After Effects to create 3d spectrograms. The initial skill set came from a tutorial:
https://www.youtube.com/watch?v=eTfB9uxJzFg&t=284s&list=WL&index=42
With a basic template to start from, I was able to modify the spectrogram for compositional and scoring purposes. These include:
https://www.youtube.com/watch?v=eTfB9uxJzFg&t=284s&list=WL&index=42
With a basic template to start from, I was able to modify the spectrogram for compositional and scoring purposes. These include:
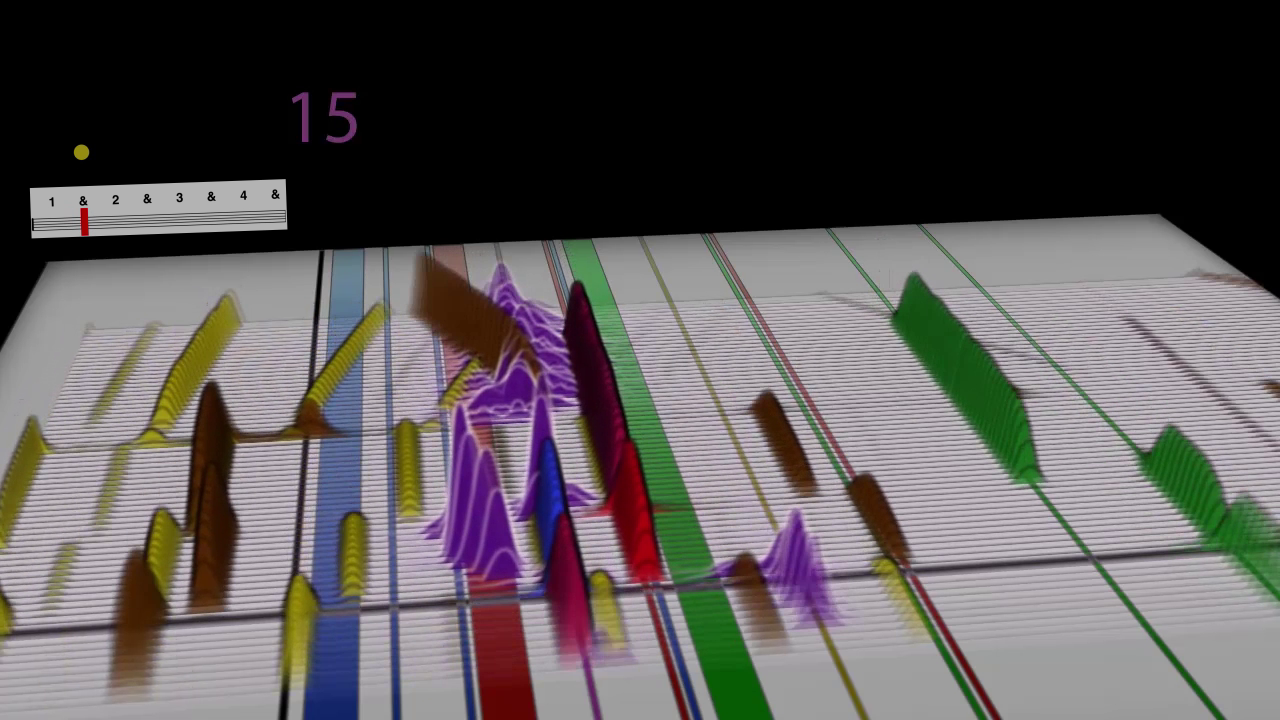
-Arranging the scrolling so that the spectrogram comes towards the viewer, allowing them to view the audio before it is played.
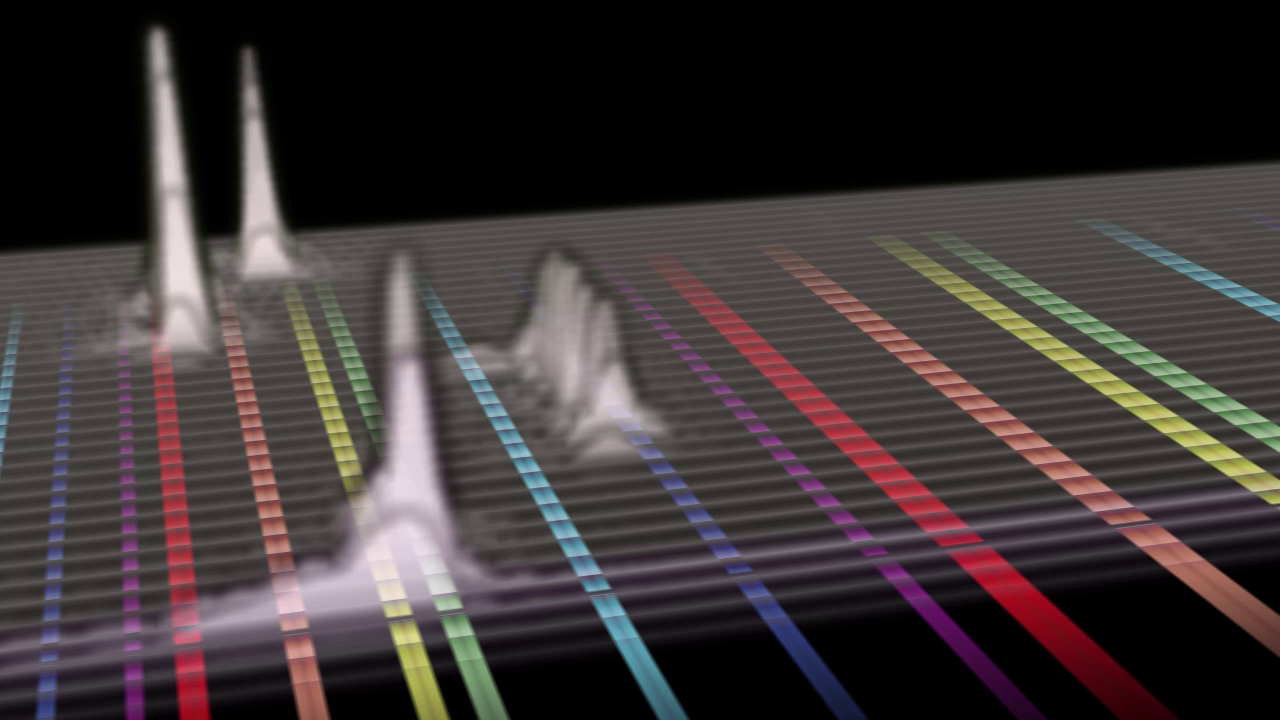
-Applying coloured overlays that correspond with frequencies. This provides a framework so that the viewer estimate the frequency of a sound with relative accuracy
-Frequencies displayed low to high, from left to right in the same way to how piano keys are layed out.
-Optimisation to maximise video quality whilst minimising render time.
Over the course of this year, the applications of this technique have developed to incorporate:
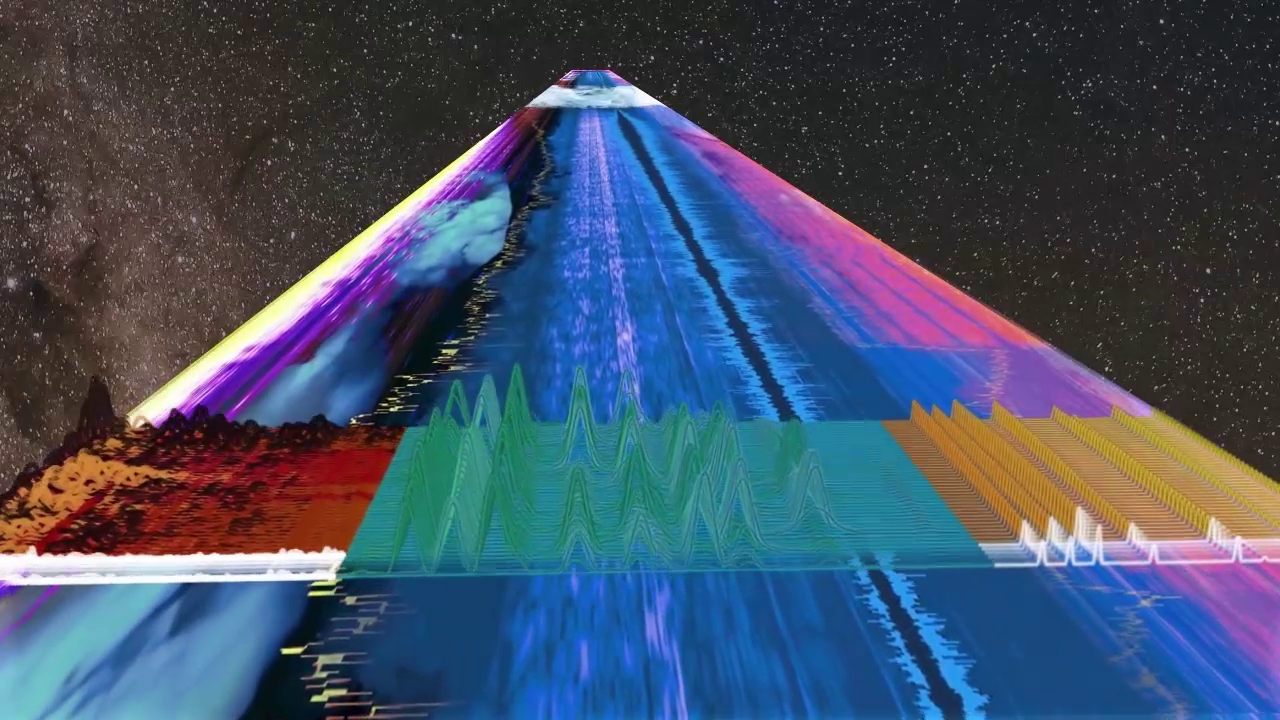
-Compositions. Manipulation and visualisation of field recordings. Creating a piece of sound art and then visualising it with the 3D spectrogram. When used this way, the priority is to create a visceral audiovisual experience for the viewer. Camera panning can be utilised to visually frame and focus on sonic points of focus within pieces.
-Transcription analysis. When used as a diagnostic tool, analysed audio can be rendered with coloured overlays, so that we can observe how close the sound frequencies comes to musical pitches. This intern can feed into compositional process, as the composer can then choose complimentary/contrasting notes to play along to the field recording.
-Scoring. Currently primarily in use with 3D printed flutes, a coloured framework corresponds with the 3D flute holes positions, along with the flute’s respective colour. This makes for an intuitive scoring technique and allows for multiple voices to be clearly expressed on the same screen.